Prometheus
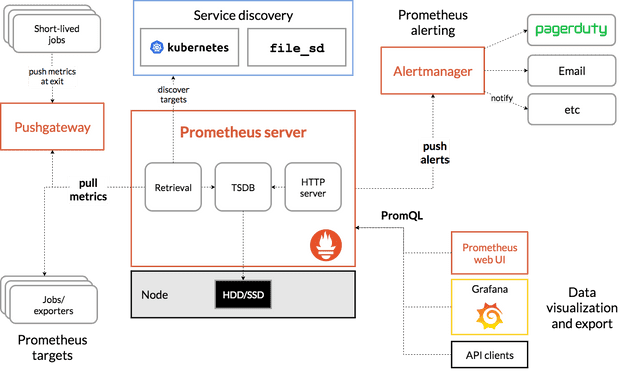
프로메테우스는 모니터링을 위한 시스템이며, time series 데이터를 수집한다.
수집되는 메트릭은 메트릭의 이름과 부가적인 key-value를 가지는 형태이다.
기본적으로는 메트릭을 프로메테우스로 쏘는 것이 아니라, 애플리케이션에 특정 엔드포인트에 관련된 데이터를 노출하고 있으면 프로메테우스가 polling하여 가져가는 형태이다.
설치
프로메테우스를 기동하는데 있어서는 메트릭을 수집할 엔드포인트, 주기 등을 나타내는 파일을 전달해야 한다.
# prometheus.yml

global:
    scrape_interval: 15s
    evaluation_interval: 15s

rule_files:
    # - "first.rules"
    # - "second.rules"

scrape_configs:
    - job_name: 'collect_spring_job'
      metrics_path: '/actuator/prometheus'
      static_configs:
      - targets: ['host.docker.internal:8080']
docker run -d \
-p 9090:9090 \
-v /Users/song/git/prometheus-settings/prometheus.yml:/etc/prometheus/prometheus.yml \
--add-host host.docker.internal:host-gateway \
--name prometheus prom/prometheus테스트를 위해 container 내에서 머신의 localhost에 접근할 수 있도록 설정이 추가되었다.
지정한 대상을 정상적으로 스크랩하는 것을 확인할 수 있다.
Metric Type
프로메테우스에서는 네 가지 메트릭 타입을 제공한다.
Counter
Counter는 단순히 값이 누적하여 증가하는 형태를 가진다. 처리한 요청의 수, 누적된 에러 수 등을 표현할 수 있으며 감소할 수 있는 지표에는 사용할 수 없다.
Gauge
Guage는 시간의 흐름에 따라 증감할 수 있는 형태를 가진다. 메모리 사용량, 활성화된 스레드 수 등을 표현할 수 있다.
Summary
Summary는 분포에 대한 지표를 나타낸다. Summary는 값의 샘플 수, 합계, 평균, 분산, 표준편차 등을 가지는데, 이를 기반으로 Quantile 값을 계산할 수 있다. 이는 값이 몇 분위에 있는지를 나타낸다. 예를 들어, Quantile이 0.5라면 중간 값을 나타낸다. 이 타입은 요청을 처리하는데 걸린 시간 등을 모니터링할 때 사용할 수 있다. 평균적으로 요청을 처리하는데 얼마나 걸렸는지, 극단적인 케이스에서는 얼마나 걸렸는지 등을 파악할 수 있기 때문이다.
Histogram
Histogram도 Summary와 유사하며 분포에 대한 지표를 나타낸다. 데이터를 버킷으로 구분하여 버킷마다 수가 얼마나되는지를 수집한다. 예를 들면 이 타입은 요청의 크기를 구분하는데 사용할 수 있다. 크기에 따라 버킷을 0 ~ 100KB, 100KB ~ 200KB와 같이 잡는다면 크기 별로 요청이 어떻게 들어왔는지 파악할 수 있다.
Spring 설정
스프링부트에서는 spring actuator를 사용해서 간단하게 기본적인 지표들을 모두 제공할 수 있다.
// build.gradle
dependencies {
  implementation 'org.springframework.boot:spring-boot-starter-actuator'
  runtimeOnly 'io.micrometer:micrometer-registry-prometheus'
}
# application.yml
management:
endpoints:
web:
exposure:
include: "prometheus"위와 같이 설정을 잡고 ‘/actuator/pprometheus’에 접근해보면 아래와 같은 내용들을 확인할 수 있으며 이 엔드포인트를 프로메테우스가 수집하게 된다.
# HELP jvm_gc_overhead_percent An approximation of the percent of CPU time used by GC activities over the last lookback period or since monitoring began, whichever is shorter, in the range [0..1]
# TYPE jvm_gc_overhead_percent gauge
jvm_gc_overhead_percent 0.0
# HELP application_started_time_seconds Time taken (ms) to start the application
# TYPE application_started_time_seconds gauge
application_started_time_seconds{main_application_class="com.example.springmonitoring.SpringMonitoringApplication",} 2.893
# HELP executor_pool_max_threads The maximum allowed number of threads in the pool
# TYPE executor_pool_max_threads gauge
executor_pool_max_threads{name="applicationTaskExecutor",} 2.147483647E9
# HELP tomcat_sessions_rejected_sessions_total
# TYPE tomcat_sessions_rejected_sessions_total counter
tomcat_sessions_rejected_sessions_total 0.0
# HELP jvm_buffer_memory_used_bytes An estimate of the memory that the Java virtual machine is using for this buffer pool
# TYPE jvm_buffer_memory_used_bytes gauge
...
Custom Metrics
이제 커스텀한 메트릭을 생성하는 방법을 알아보자.
Counter
몇 개의 요청이 발생했는지 Counter로 기록한다.
@Slf4j
@RestController
@RequiredArgsConstructor
public class CounterController {
    private final Counter requestCounter = Metrics.counter("request_count");

    @GetMapping("/counter")
    public String counter() {
        requestCounter.increment();

        return "hello prometheus!";
    }
}
Gauge
Executor에서 현재 활성화된 스레드 수가 몇개인지 기록한다.
@Slf4j
@RestController
@RequiredArgsConstructor
public class GaugeController {
    private final Executor executorForGauge;

    @GetMapping("/gauge")
    public String gauge() {
        for (int i = 0 ; i < 10 ; i++) {
            executorForGauge.execute(() -> {
                try {
                    log.info("sleep!");
                    Thread.sleep(1000L);
                } catch (InterruptedException e) {
                    throw new RuntimeException(e);
                }
            });
        }

        return "hello prometheus!";
    }
}
@Configuration
public class GaugeWorkerConfig {
@Bean
public Executor executorForGauge() {
ThreadPoolTaskExecutor executor = new ThreadPoolTaskExecutor();
executor.setCorePoolSize(5);
executor.setMaxPoolSize(10);
executor.setDaemon(true);
executor.setThreadNamePrefix("gauge");
executor.initialize();
Metrics.gauge(
"thread_gauge",
executor,
ThreadPoolTaskExecutor::getActiveCount
);
return executor;
}
}Summary
요청을 처리하는데 시간이 얼마나 걸리는지 측정한다.
@Slf4j
@RestController
public class SummaryController {
	private static final DistributionSummary requestLatency = Metrics.summary("request_latency_1");

	private static final RandomGenerator randomGenerator = RandomGenerator.getDefault();

	@Timed(value = "request_latency_2")
	@GetMapping("/summary")
	public String summary() {
		Long startTime = System.currentTimeMillis();
		long sleep = randomGenerator.nextLong(3000);
		try {
			Thread.sleep(sleep);
		} catch (Exception e) {
			log.error("exception is occurred.", e);
		} finally {
			Long endTime = System.currentTimeMillis();
			requestLatency.record(endTime - startTime);
		}

		return "hello prometheus!";
	}
}
@Configuration
public class TimedConfig {
// @Timed 사용을 위함
@Bean
public TimedAspect timedAspect(MeterRegistry registry) {
return new TimedAspect(registry);
}
}예시들은 로우 레벨로 작성되었지만
@Timed처럼 목적에 맞게 추상화된 다양한 메트릭 수집법을 제공한다.
Grafana
그라파나는 메트릭 시각화 도구이다. 프로메테우스에 의해 수집된 메트릭만이 아니라 여러 데이터소스를 사용할 수 있으며, 각 metrics에 threshold를 지정해서 슬랙이나 이메일 등으로 노티하는 기능 등을 제공하고 있다.
설치
docker run -d \
-p 3000:3000 \
--add-host host.docker.internal:host-gateway \
--name grafana grafana/grafana-oss
테스트를 위해 container 내에서 머신의 localhost에 접근할 수 있도록 설정이 추가되었다.
대시보드 생성
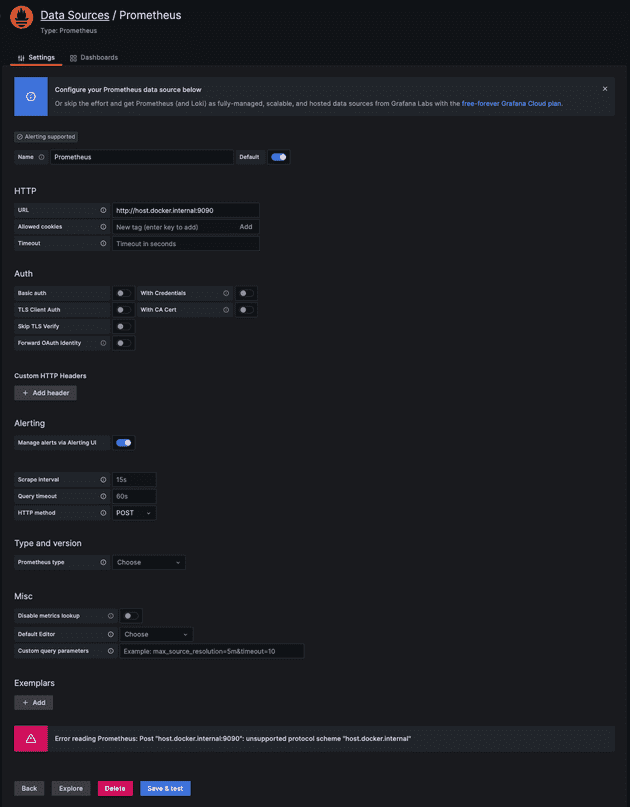
프로메테우스를 데이터 소스로 등록한다.
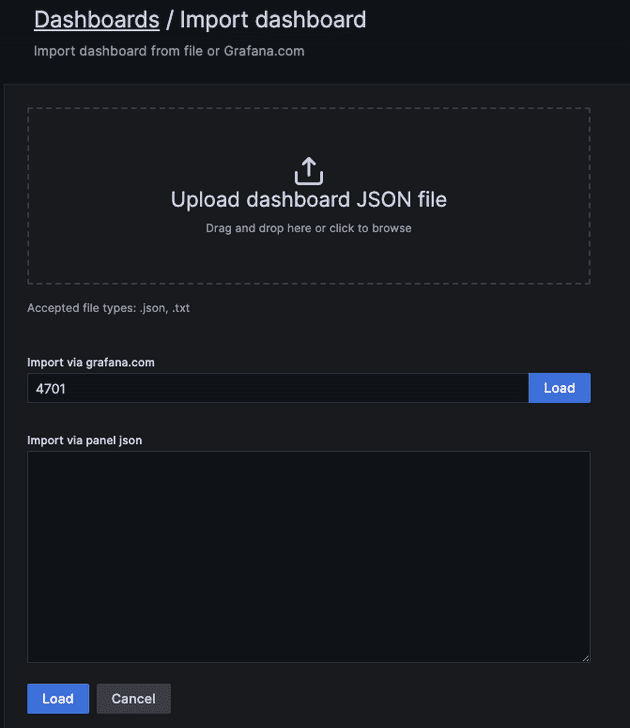
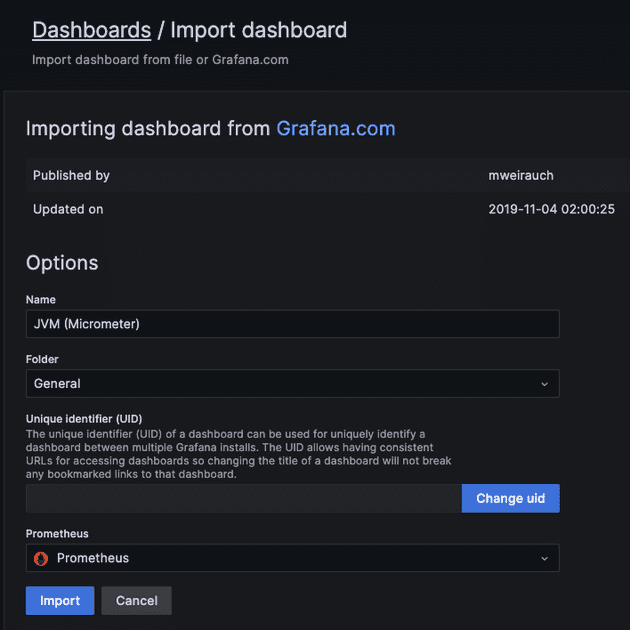
그리고 이 데이터 소스를 기반으로 대시보드를 등록한다. 커스텀하게 만들 수도 있지만 기본적으로 제공하는 템플릿을 활용할 수도 있다.
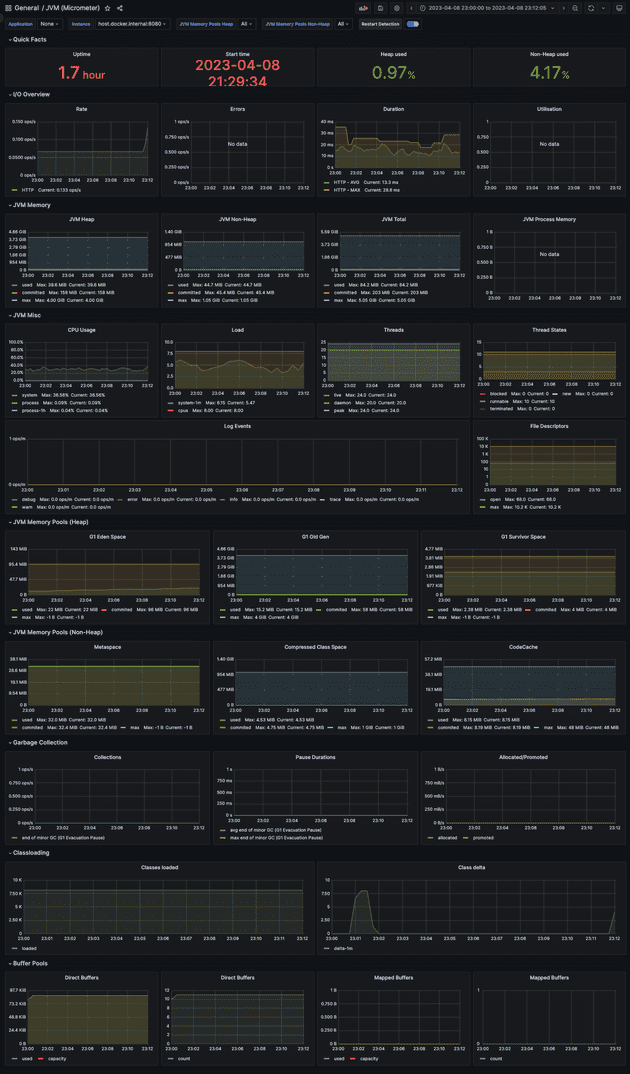
그러면 아래와 같이 그럴싸한 대시보드를 얻을 수 있다.
참고
